
Your Google Ads says it generated 120 sales last month. Meta says it drove 95. Add those up, and you have 215… except your CRM only recorded 140 total sales across every channel combined. The numbers don’t match, and they never will until you change how you are measuring.
Marketing attribution models are supposed to tell you which channels are actually driving revenue. Most of the time, they are just telling you which channels got clicked.
That is exactly what we are going to fix here. We will show you 6 marketing attribution models and when each one fits. You will also see why most setups fail to track actual revenue – and what to do about it so your reporting connects to closed deals, not just form fills.
What Are Marketing Attribution Models?
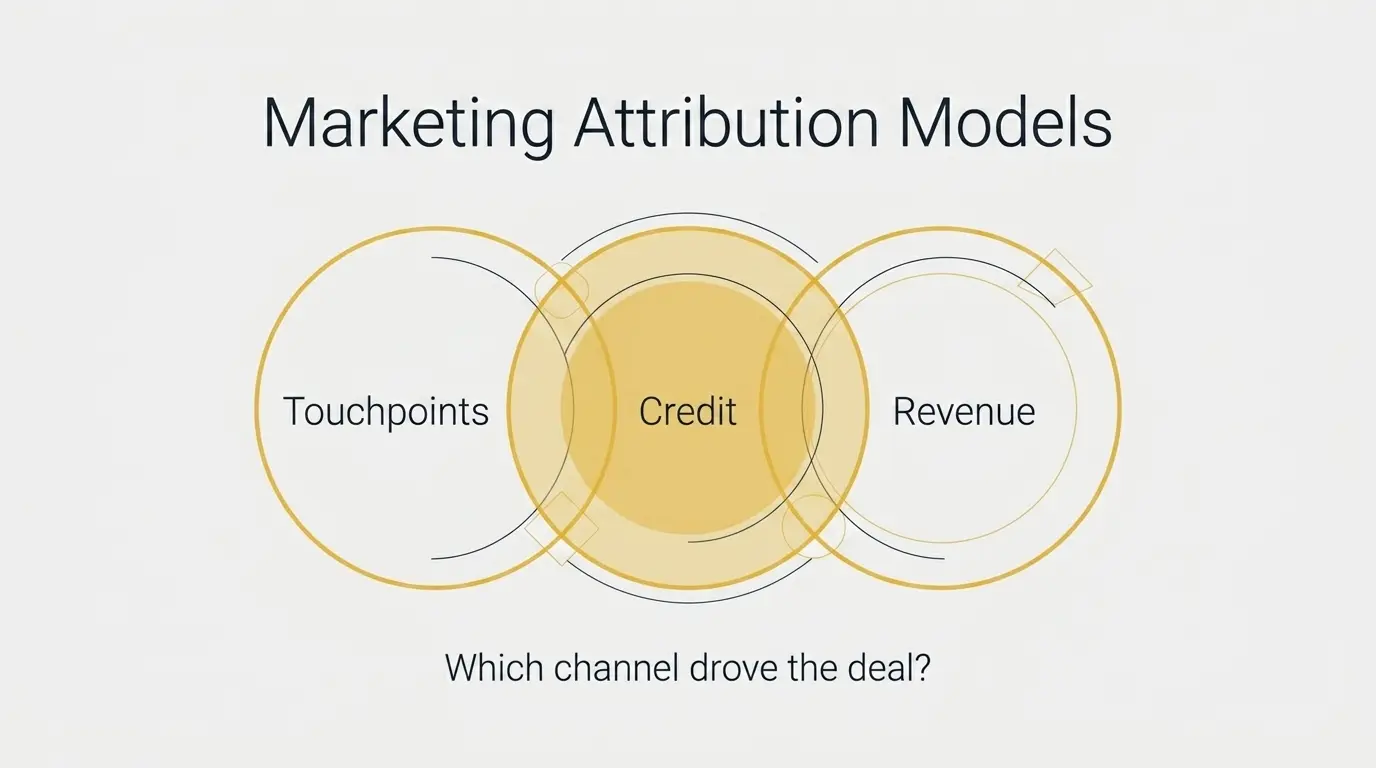
Marketing attribution models are the rules you use to assign credit to marketing touchpoints when someone converts. A prospect sees a LinkedIn ad on Monday. They read a blog post on Wednesday. They click a retargeting ad on Friday and request a demo. The model decides who gets the trophy for that conversion – and how much of it.
Without the right marketing attribution model, you just have channel dashboards that each claim credit for the same deal. Google says it worked. Facebook says it worked. Your email platform says it worked. Attribution is supposed to sort that out.
The problem is that most teams set one up in Google Analytics and never connect it to what actually closed in the CRM. So the model runs on clicks and form fills instead of dollars.
Attribution vs Incrementality: Two Different Questions
Attribution and incrementality sound related, but they are asking different things. Attribution asks: which channel should get credit for this sale? Incrementality asks: would this sale have happened anyway if that channel didn’t exist?
A channel can receive full attribution credit and still not be creating additional revenue. Someone who typed your brand name into Google and clicked a branded search ad was probably going to buy regardless. The ad didn’t cause the sale; it just caught the click.
Attribution gives the ad credit. Incrementality would say the ad added nothing. Both perspectives matter, and confusing them leads to budget decisions that look right on the attribution report but don’t actually move revenue.
6 Marketing Attribution Models and When Each One Makes Sense
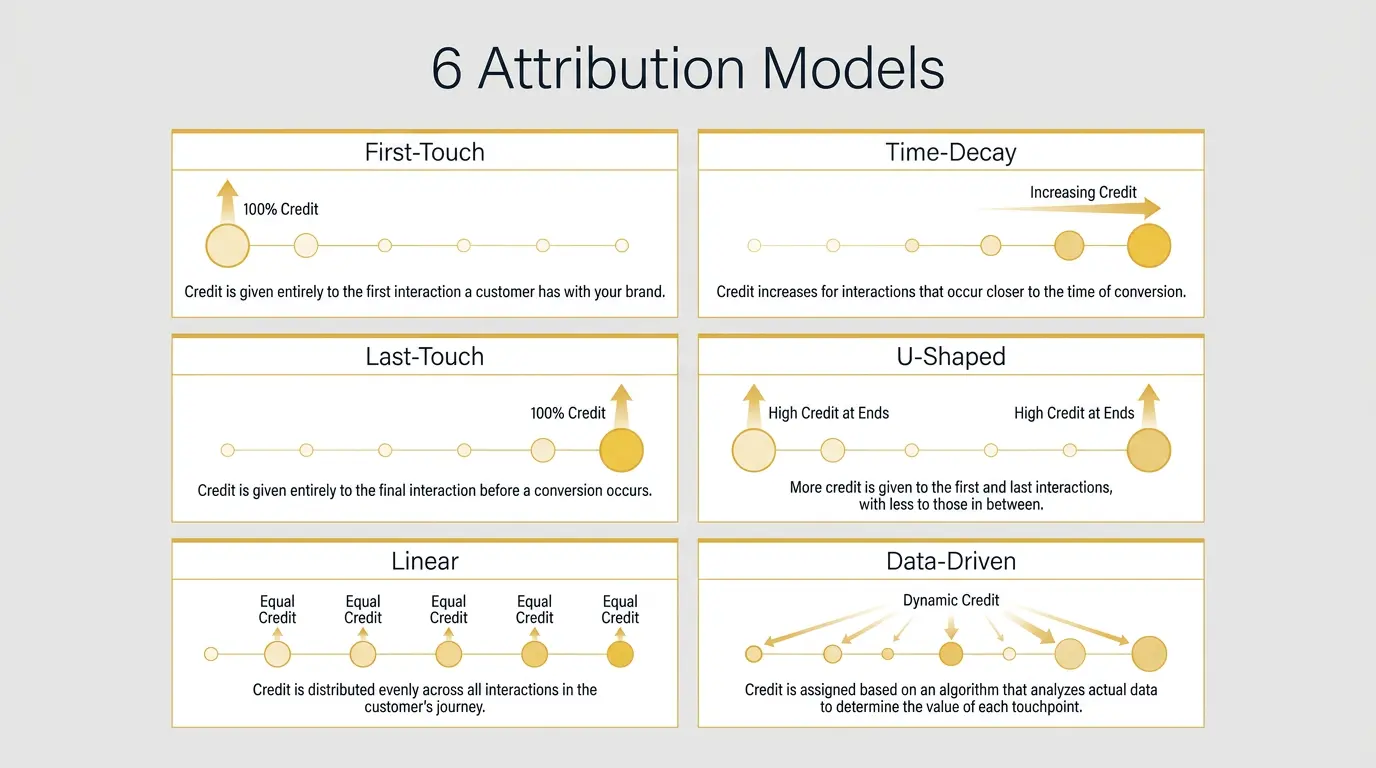
These 6 types of attribution models answer the same question differently: Who deserves credit for the sale? The best attribution model for your business depends on how long your deals take to close and how many channels a buyer touches along the way.
It is worth noting that first-touch, linear, time-decay, and U-shaped are general attribution frameworks used across the industry. They are not all available as selectable models inside GA4.
1. First-Touch Attribution Model — Credits the Channel That Started the Relationship
First-touch hands 100% of the credit to whatever brought the prospect in originally. Someone found you through a Google search six months ago? That search gets all the credit for the deal that just closed, even though multiple touchpoints happened between then and now.
It is good for one thing: showing you where new people are entering the funnel. If you are trying to figure out which channels bring in fresh audiences, first-touch tells you that clearly. But it is blind to everything that happened after the first click. For B2B teams where the first touch and the closed deal are months apart, this model misses the entire middle of the story.
2. Last-Touch Attribution Model — Credits the Channel That Closed the Deal
Last-touch does the opposite. It gives everything to the last interaction before the conversion. Clicking a retargeting ad right before requesting a demo gets 100%. The blog post and the email that warmed them up? Zero credit across the board.
GA4 actually uses data-driven attribution by default for key-event reporting, not last-touch. But marketers can compare data-driven results with last-click reporting, and many third-party tools still default to last-click.
Either way, retargeting often looks like the strongest channel in last-click reports because it is usually the final interaction before conversion. But retargeting didn’t create the demand. It just showed up at the finish line.
Some ROAS benchmarking studies report noticeable differences between platform-reported revenue and backend revenue, although the size of that gap varies by business and measurement setup.
3. Linear Attribution Model — Splits Credit Equally Across Every Touchpoint
Linear just divides credit equally. Four touchpoints before conversion get 25%. Nobody is special. Nobody is overlooked. It is the simplest way to do multi-touch.
The good part is that nothing gets ignored. Every channel that played a role shows up in the report. The bad part is that it treats a random display ad the same as the pricing page visit that actually tipped the decision.
When everything weighs the same, you can’t figure out what is genuinely moving people forward versus what is just happening to be in the room. The debate between organic and paid channels gets especially murky under linear – because a blog post read three months ago gets the same credit as the Google Ad clicked yesterday.
The same challenge applies to retail businesses with longer buying journeys. For example, someone shopping Joe & Bella’s magnetic clothing collection might first discover the brand through an educational article on adaptive clothing before interacting with several other touchpoints.
Under a linear attribution model, each interaction receives equal credit, making it harder to identify which touchpoints created awareness and which ultimately influenced the purchase.
4. Time-Decay Attribution Model — Gives More Credit to Touchpoints Closer to Conversion
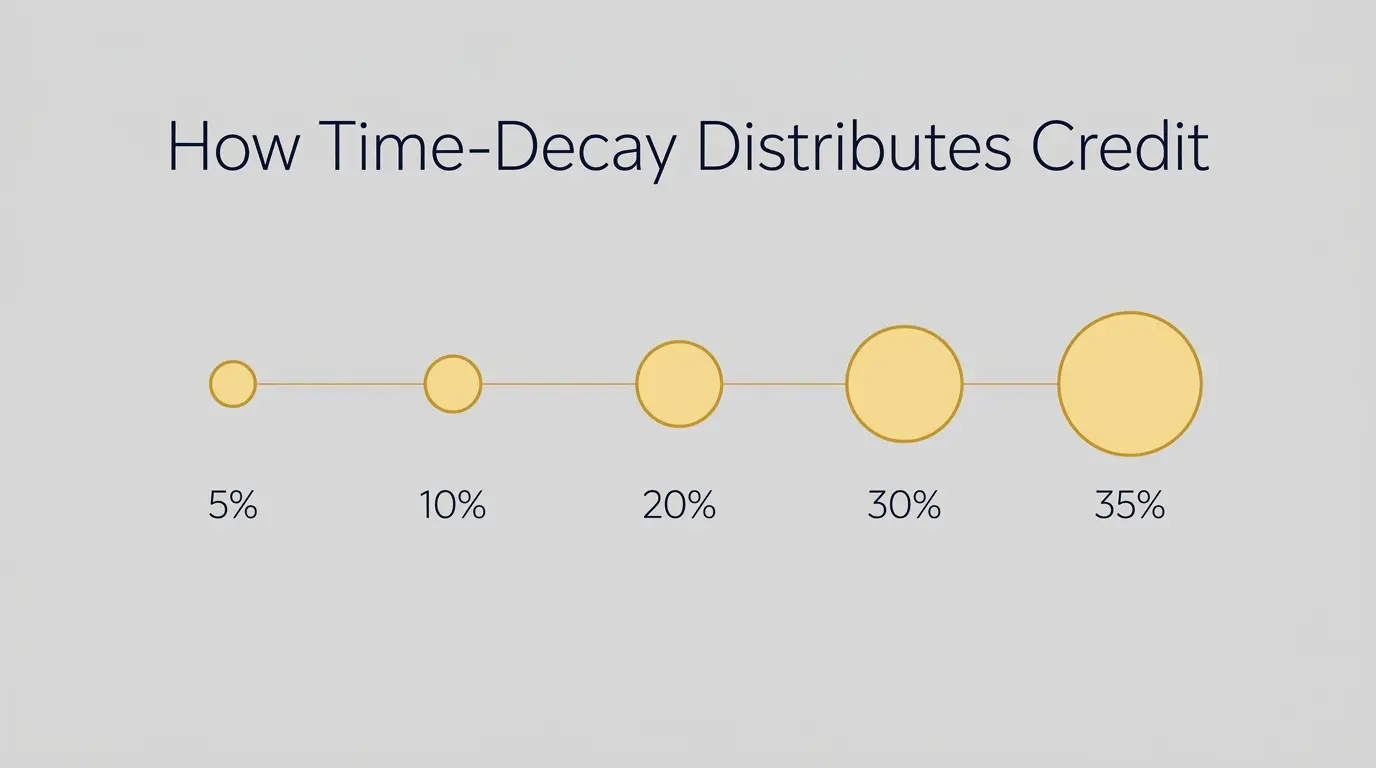
Time-decay works like linear but with a gradient. It gives more weight to recent customer interactions before conversion. Touchpoints closer to the conversion get a bigger share. The blog post from three months ago gets a sliver. The email clicked last week gets more. The pricing page visited yesterday gets the biggest piece.
For longer sales cycles, this makes more gut-level sense. The stuff that happened right before the decision probably did matter more. But the risk is that your attribution report starts saying content marketing produces almost no revenue because content is usually the earliest touchpoint. Cut that budget, and you will eventually wonder why the pipeline dried up.
This is especially common in industries with longer buying cycles. For example, a business like Golf Cart Tire Supply might see customers return to product pages several times before purchasing.
A time-decay model would give more credit to the comparison page they visited two days before buying and much less to the Facebook ad that introduced the brand six weeks earlier, even though both likely influenced the decision.
5. U-Shaped (Position-Based) Attribution Model — Weights First and Last Touch Heaviest
U-shaped gives 40% to the first touchpoint and 40% to the last. The remaining 20% gets divided across everything in between. It is a compromise that respects both ends of the customer journey – the channel that started the relationship and the one that closed it – while still leaving some credit for the nurturing that happened in the middle.
For B2B teams, this is one of the more practical marketing attribution models because it answers two questions at once: where are leads coming from, and what is converting them. The middle touchpoints get enough visibility to justify their budgets without dominating the report.
6. Data-Driven Attribution Model — Lets the Algorithm Assign Credit Based on Actual Patterns
Data-driven attribution belongs to a group of algorithmic attribution models. It looks at all your conversion paths and uses machine learning to figure out which touchpoints actually influenced outcomes. Google Ads has this built in, and GA4 uses it as the default for key-event reporting.
Data-driven attribution is not limited to large accounts. Smaller businesses can also use it but lower conversion volume means the algorithm has less data to learn from, which can make the credit assignments less reliable.
A store running three campaigns with 50 conversions a month will get data-driven results, but the patterns the model detects may shift significantly from month to month simply because the sample size is small.
It is also a black box. You see the credit distribution, but you can’t see the reasoning. For teams running big multi-channel operations with thousands of conversions per month, it is often the strongest option available. For smaller teams, the outputs may fluctuate too much to be actionable.
| Model | Best For | Biggest Blind Spot |
| First-touch | Seeing where new leads come from | Ignores everything after the first click |
| Last-touch | Seeing which marketing channel closes deals | Often over-credits retargeting and branded search |
| Linear | Teams wanting equal channel visibility | Treats every touchpoint as equally important |
| Time-decay | Long sales cycles with many interactions | Can undervalue top-of-funnel awareness work |
| U-shaped | B2B with clear entry and conversion events | Middle touchpoints get squeezed into 20% |
| Data-driven | Accounts with enough conversion volume for reliable patterns | Less reliable at low volume – results may fluctuate |
Why Most Marketing Attribution Models Fail to Track Real Revenue
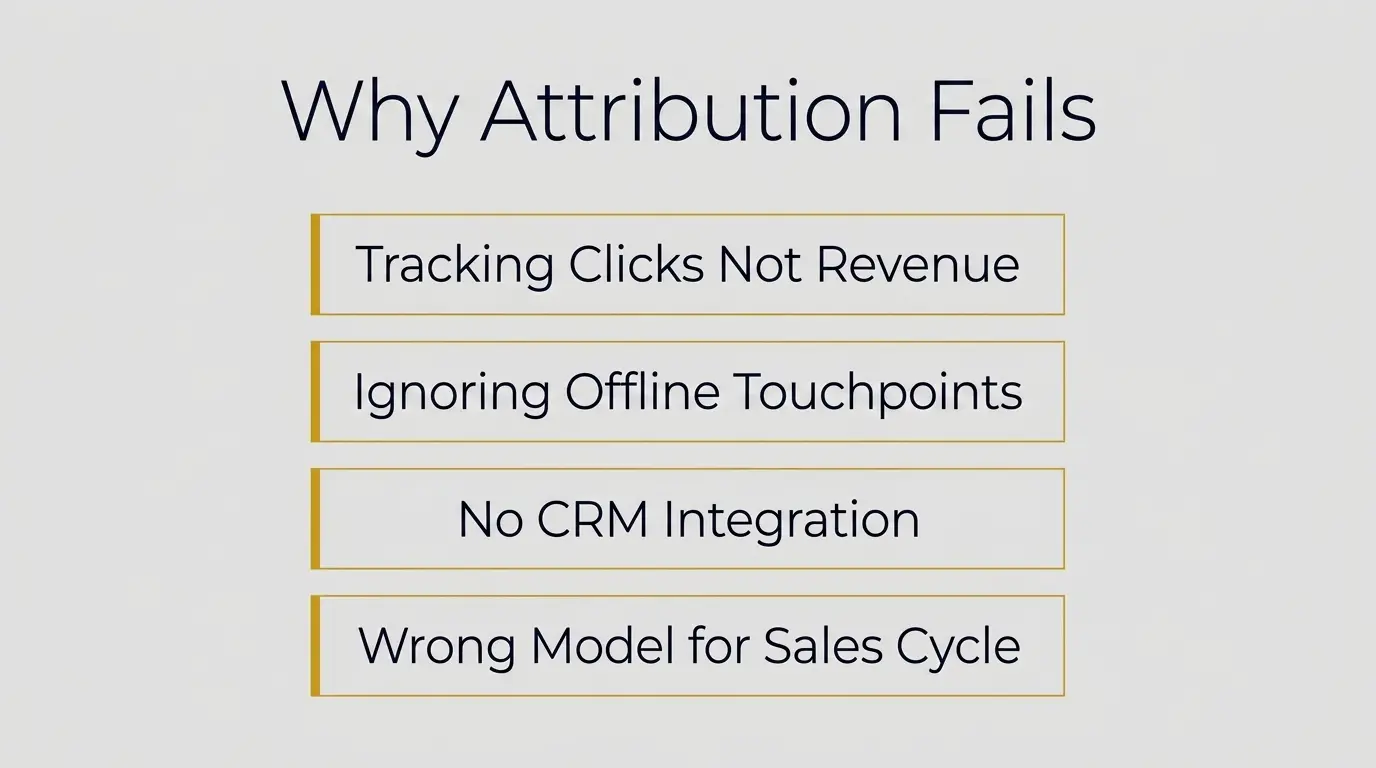
Choosing among different attribution models takes 10 minutes. Getting it actually to reflect revenue across your marketing efforts is where everyone gets stuck.
And even when the setup is right, attribution models still estimate credit based on the interactions they can see. They don’t reveal the complete picture of what caused a sale. These are the four places where the disconnect shows up most.
1. Tracking Clicks and Leads Instead of Closed Deals
Most attribution setups count the form fill as the conversion. Requesting a demo is a win in the report. But that lead might be in the CRM for three months before getting disqualified. If your model counts every form fill as a success, the report says your campaigns are producing results even when the pipeline is full of leads that never closed.
The fix isn’t scrapping form-fill tracking entirely – form submissions still help ad platforms optimize toward the right audience. But relying on them as your primary performance metric is where things can go wrong. Tracking multiple stages gives you a better picture:
- Form submissions (useful for ad platform optimization)
- Qualified leads (first filter for actual fit)
- Sales opportunities (pipeline value)
- Closed deals and revenue (actual business outcome)
Ad platforms need early-stage signals like form fills to optimize delivery. But when you are evaluating whether a channel is actually producing revenue, qualified leads and closed deals are the numbers that matter.
2. Ignoring Offline Touchpoints That Influence the Purchase Decision
A prospect reads your blog and clicks your ad. Then they have a 20-minute conversation with your sales rep at a trade show. A week later, they convert through branded search. Your attribution model sees the blog, the ad, and the search. It doesn’t see the trade show conversation, which may have been the thing that actually moved them forward.
This is also common for businesses where key decisions happen offline. For example, someone might discover Business For Sale through a Google ad but decide to list their business only after an advisory phone call.
While recording those conversations in a CRM can improve reporting, attribution models still estimate rather than prove which interaction drove the conversion.
3. Running Attribution Without CRM Integration
Attribution that is only in Google Analytics or your ad platform is attribution without revenue attached. Those tools know when someone clicks and when someone fills out a form. They have zero idea when that person turned into a $50K customer six months later.
Connecting your CRM to your attribution data is an effective way to close that loop. Most marketing automation tools support this natively. It won’t give you a perfectly accurate picture of which campaign caused which sale – attribution still assigns credit based on the touchpoints it can track. But it gets you much closer to reality than form-fill data alone.
The blocker usually isn’t technical. It is organizational. Marketing owns the ad platforms. Sales owns the CRM. And the two data sets never get introduced to each other.
4. Using a Model That Doesn’t Match Your Sales Cycle Length
A SaaS product with a 14-day free trial and an enterprise deal with an 8-month sales cycle should not be using the same attribution model. But they often do – because somebody picked a default model during the initial setup and nobody went back to change it.
Short sales cycles can get away with simpler models because there aren’t many touchpoints to distribute credit across. Longer cycles need multi-touch models that can handle dozens of interactions spread over months.
If your average deal takes 90+ days and you are running first-touch or last-touch, the model can’t easily show you what is working in the middle of the journey. Your marketing stack might be collecting all the data… the model just isn’t using it.
How to Set Up Attribution That Connects Marketing Spend to Revenue
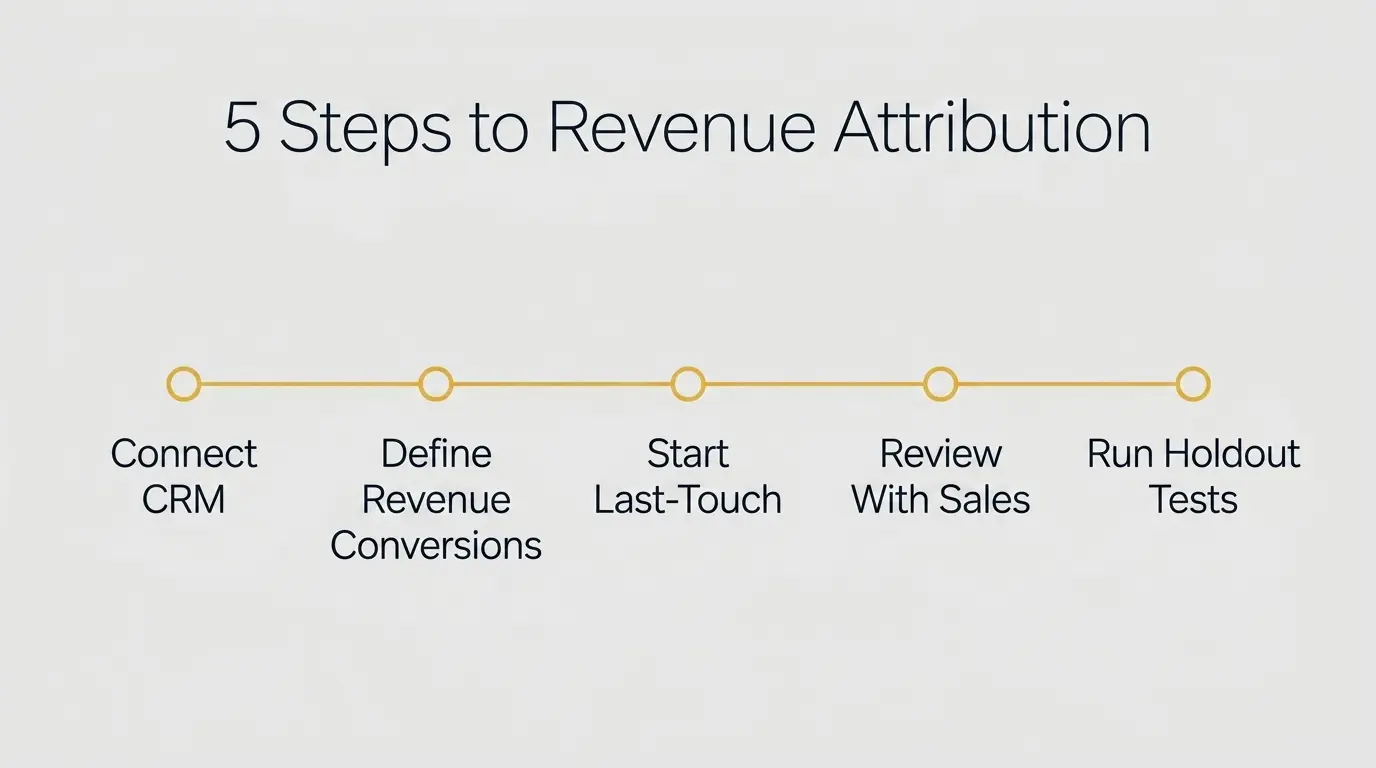
The tools already exist. Most teams just haven’t connected them together. These 5 marketing attribution strategies take you from “we know which ads got clicked” to “we can see which ads are associated with actual revenue.”
1. Connect Ad Platforms to Your CRM Before Picking a Model
None of the model choices matter much if the data pipeline stops at the form fill. When your ad platforms can see CRM outcomes – which leads closed and how much they were worth – the attribution report starts speaking in dollars instead of click counts.
That connection improves every budget conversation because you are comparing channels on revenue data, not just impressions. It still won’t tell you with certainty that a specific campaign caused a specific sale, but it gets your reporting much closer to business reality.
- Set up offline conversion imports between Google Ads and your CRM natively
- Pass a unique click ID through every form so CRM deals trace back to ad clicks
- Import closed-won revenue into Google Analytics as a custom conversion value
- Verify by tracing one real closed deal from ad click through CRM to the report
2. Define Conversions in Revenue Terms, Not Lead Count
When your model defines “conversion” as a form fill, a channel that generates 200 leads and closes 3 deals looks better than one that generates 40 leads and closes 12. The math says the first channel is winning. The bank account says the opposite.
That disconnect exists because the model is rewarding volume instead of value. And it stays broken until you change what counts as a conversion.
- Track form fills for ad optimization, but use qualified leads and closed deals to evaluate performance
- Assign actual deal values to each conversion instead of counting all equally
- Build separate views for lead count versus revenue to spot where they diverge
- Report cost per closed deal alongside cost per lead in every review meeting
3. Start With Last-Touch, Then Layer Multi-Touch as Data Grows
Jumping straight into U-shaped or data-driven attribution without a baseline gives you reports nobody trusts. Last-touch has obvious flaws. But it is simple enough that everyone in the room understands what it is saying.
Start with simple single-touch attribution models before adding more complex ones. After six months of revenue-connected data flowing through, you have enough history to add a multi-touch attribution model alongside it and see whether the two tell different stories about where budget should go.
- Run last-touch for two quarters while your revenue data baseline builds up
- Add U-shaped or time-decay as a secondary model and compare weekly outputs
- Only switch primary models after comparing multiple attribution models over time
- Keep last-touch running as a sanity check even after going multi-touch
4. Review Attribution With Sales Monthly, Not Just Marketing
When only the marketing team looks at attribution reports, you are hearing one side of the story. Sales knows which leads were actually worth a conversation and which ones wasted 30 minutes of an AE’s day.
A monthly sit-down where marketing shows the attribution data and sales says “here’s what actually happened with those leads” is what turns this from a reporting exercise into something that actually shapes your digital marketing strategy and helps optimize marketing spend based on revenue.
- Block a monthly 30-minute attribution review with marketing and sales leadership
- Have sales tag the top 5 and bottom 5 leads by source quality in the CRM monthly
- Compare the attribution report against close rates by channel to find mismatches
- Shift channel budgets based on combined data, not marketing dashboards alone
Retention data should be part of the picture as well. Comparing acquisition channels against repeat purchase rates and customer lifetime value helps identify which channels attract loyal customers, not just first-time buyers.
For example, tools like BonusQR can track return visits through QR-based loyalty programs, which makes it easier to see which channels drive repeat business instead of one-time purchases.
5. Run Holdout Tests to Validate Your Model’s Accuracy
Attribution models estimate credit. Holdout tests measure whether removing a channel actually changes outcomes. The idea is to compare a group that continues seeing your ads with a similar group that doesn’t, and measure the difference over a period that reflects your actual sales cycle.
For a product with a 2-week buying window, a 14-day test might work. For B2B deals that take several months, you would need a longer holdout and a large enough sample to account for natural variation.
Simply pausing LinkedIn ads for two weeks and checking whether the pipeline changed isn’t a reliable test when deals take 90 days to close. The effect wouldn’t show up in the data yet.
- Split your audience into a test group (no ads) and a control group (ads continue) for cleaner measurement
- Run the holdout for a period that matches your typical sales cycle length, not an arbitrary two weeks
- Compare the actual result to what the model predicted would happen without that channel
- Adjust credit weighting for that channel based on what the holdout actually showed
Conclusion
Marketing attribution models estimate how credit should be divided based on the interactions they can track. They don’t reveal the full truth, but the teams that connect their CRM to their ad platforms, track multiple conversion stages, and bring sales into the reporting conversation get a much more useful picture than teams running default settings on form-fill data.
The model matters less than whether the data going into it reflects what actually happened in the business.
At Reliqus, we help businesses improve conversion tracking, connect marketing activity with CRM outcomes, and build clearer reporting around lead quality and revenue. If your current setup can’t connect what marketing is spending with what sales is closing, we can help you close that gap. Book a free consultation now.

Burkhard Berger
He helps innovative B2B companies implement modern SEO strategies to scale their organic traffic to 1,000,000+ visitors per month. Curious about what your true traffic potential is?